Growth
Our second actionable component is to grow our General Tool and Specialty businesses through the ongoing structural progression of our business and industry. We are evolving our cluster approach as we look to increase our fleet density. We believe that there is a clear opportunity to increase the fleet density in our markets through accessing the latent capacity in our existing locations, particularly those added through Sunbelt 3.0 and supplementing those through further greenfield locations. In this way, we aim to ensure that rental penetration increases in ever broadening markets as our market density grows. We aim to add 300-400 greenfield locations during Sunbelt 4.0.
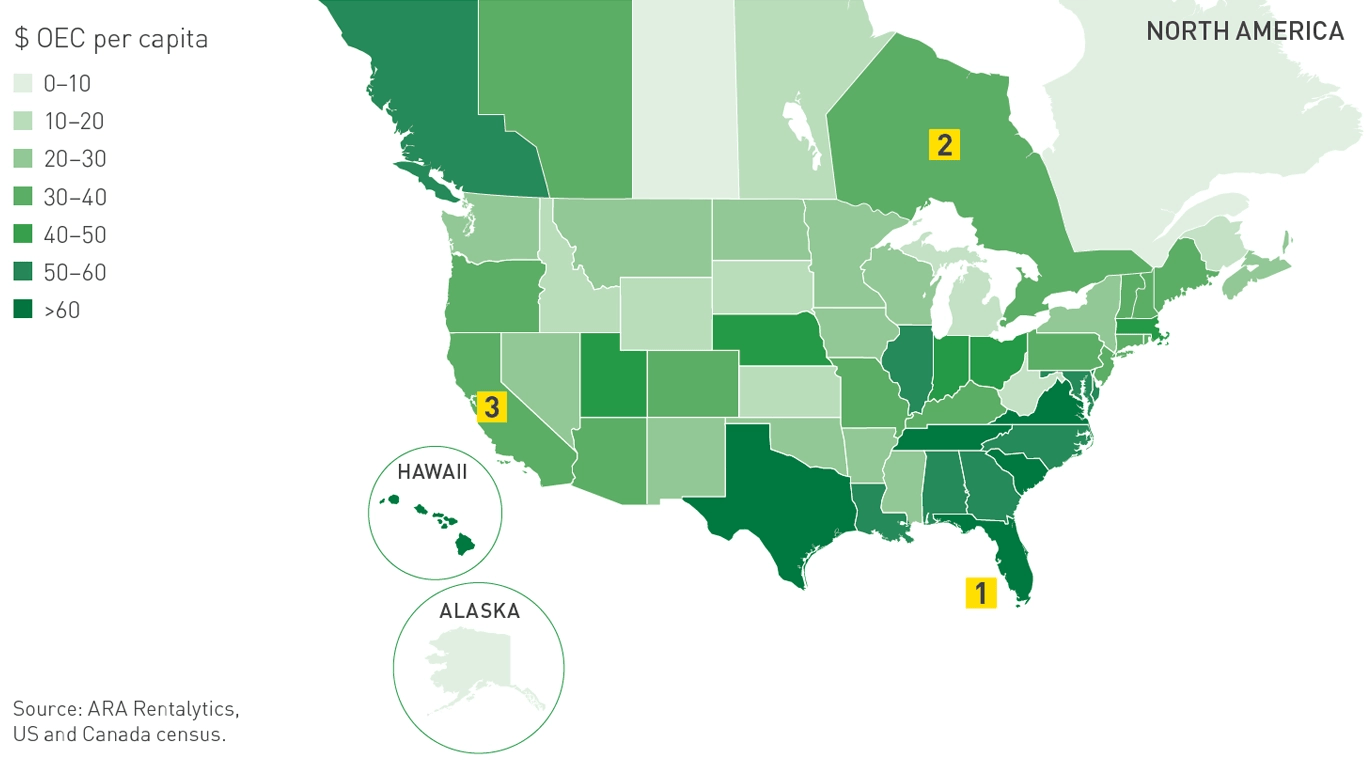
To illustrate our opportunity, the fleet density map below shows fleet density (original equipment cost (‘OEC’) per capita) by state. Highlighting three markets, each of which we believe has opportunity for further growth:
| Florida: $76 of OEC per capita with 103 locations and being the third largest US rental market | |
|---|---|
| Ontario: $40 of OEC per capita with 63 locations and being the largest Canadian rental market | |
| California: $34 of OEC per capita with 126 locations and being the largest US rental market |
We would need a fleet size of $29bn to achieve the same level of fleet density throughout North America that we have in Florida.

Continuing to advance our cluster approach
Our cluster approach has been a very important aspect of our strategy and success at building the business to where we have the scale we have today. We are now focusing also on increasing our market density where we have clusters. Our greenfield sites are chosen to enhance our existing business and we believe that this approach continues to provide significant continuing opportunity for growth. We focus on building clusters of stores because, as they mature, they access a broader range of markets unrelated to construction leading to better margins and return on investment.
The size and composition of a cluster depends on the market size based on Designated Market Areas. We have defined clusters such that a top 25 market cluster in the US has more than 15 stores, a top 26-50 market cluster more than ten stores and a top 51-100 market more than four stores. We also include the smaller 101-210 markets within our cluster analysis although our focus is predominantly on the top 100 markets in the US. Nevertheless, we have found that the smaller markets, while performing less well than others overall, often prove more resilient when times are less good.
Our definition of a cluster in these markets is two or more stores. With the advanced technology we have in place, we can analyse local market data accurately. This allows us to find similarities between certain US and Canadian centres, and model our growth plans accordingly. The more customers get to know and trust us, the faster we are able to grow.
We focus on ensuring our clusters meet the multiple needs of local customers even if that means some stores may appear to perform less well than others. The interaction of the stores in a cluster is what gives us real competitive advantage. We find that having a blend of locations is highly desirable and we like to mix up the large equipment locations with smaller General Tool stores. The addition of Specialty stores serves to differentiate us from competitors in the area. This enables us to broaden and diversify our customer base and our end markets, as we extend our reach within a market. The value is in the mix of products and services we are able to provide in a concentrated environment.
Customer
The first of our actionable components is to elevate our obsession with customer service and their success throughout the organisation to a level unparalleled in the broader business sector.
Performance
Our third actionable component is performance, unlocking the capacity to operate more efficiently through process, technology and scale, resulting in margin progression with growing revenues.

